Elastic Cloud Enterprise
Overview / Introduction
Elasticsearch Cloud is a fully managed Elasticsearch service provided by Elastic (the company behind Elasticsearch). Unlike self-managed (unmanaged) deployments where you install and maintain Elasticsearch on your own servers (Windows, Linux, AWS EC2, GCP, Oracle Cloud, etc.), the managed service handles all infrastructure, security, monitoring, upgrades, and maintenance automatically.
Key Distinction:
- Unmanaged Service: You install, configure, secure, monitor, and maintain Elasticsearch yourself on your own infrastructure
- Managed Service (Elasticsearch Cloud): Elastic handles all operational tasks; you simply configure resources through a UI and focus on using the service
The managed service is also known as Software as a Service (SaaS) and significantly reduces operational overhead while ensuring high availability and automatic backups.
Important Concepts & Definitions
Managed vs Unmanaged Elasticsearch
Unmanaged Elasticsearch (Self-Managed):
- Install Elasticsearch manually on Windows, Linux, or cloud VMs
- Manually create and manage SSL/TLS certificates
- Monitor service health, CPU, memory, disk usage yourself
- Perform root cause analysis when issues occur
- Manually upgrade Elasticsearch versions (requires backup, download RPMs, restart nodes)
- Manage network ports, firewall rules, and security settings
- Deploy and configure Kibana, Fleet servers, APM servers separately
Managed Elasticsearch (Elasticsearch Cloud):
- Automatically installs and configures Elasticsearch, Kibana, Fleet, APM servers
- Automatically manages SSL/TLS certificates (no expiration concerns)
- Automatically monitors cluster health and restarts services if needed
- Automatically provides root cause analysis via email alerts
- One-click upgrades between Elasticsearch versions
- Automatic port management and secure networking
- Automatic snapshots every 30 minutes
- Provides detailed performance monitoring and alerting
Key Benefits of Managed Service
- No Infrastructure Management: Select memory/storage requirements; service handles deployment
- Automatic Security: Certificates, passwords, encryption managed automatically
- Auto-Restart: If memory/CPU exceeds 95%, service restarts automatically and sends root cause analysis
- Easy Upgrades: Select target version, click upgrade; service handles node-by-node upgrade without downtime
- High Availability: Deploy across multiple availability zones (e.g., ap-south-1a, ap-south-1b)
- Automatic Backups: Snapshots taken every 30 minutes and stored securely
- 99.95% Monthly Uptime SLA: Guaranteed availability
Deployment Architecture
Default Free Trial Configuration:
- Hot Tier: 2 nodes (120 GB storage, 4 GB RAM per node) across 2 availability zones
- Kibana: 1 node (1 GB RAM)
- Integration Server (Fleet): 1 node (1 GB RAM)
- Machine Learning Node: Optional
- Total: 240 GB storage, 8 GB RAM across hot tier
Advanced Tier Configuration (Paid):
- Warm Tier: Lower-cost storage for less frequently accessed data
- Cold Tier: Even lower-cost storage
- Frozen Tier: Lowest-cost archival storage (6.25 TB per 4 GB RAM)
- Dedicated Master Nodes: Required when cluster exceeds 5-6 nodes
- Coordinating Nodes: Handle search requests coordination
- Ingest Nodes: Process data before indexing
Node Roles and Responsibilities
Node Role Abbreviations (visible in GET _cat/nodes):
- h: Hot data node (frequently accessed data)
- w: Warm data node (less frequently accessed)
- c: Cold data node (rarely accessed)
- f: Frozen data node (archival)
- i: Ingest node (data processing)
- m: Master eligible node
- s: Content node
- r: Remote cluster client
- t: Transform node
- v: Voting-only master node (tie-breaker for master elections)
- ml: Machine learning node
Cost Considerations
Free Trial:
- 14-day trial period (extendable to 45 days by contacting support)
- Limited to 1 deployment
- No credit card required during trial
- After trial expires, must subscribe or create new account with different email
Paid Subscription:
- Charged based on resource usage (RAM, storage, CPU)
- Higher cost than self-managed infrastructure (e.g., if 4 GB RAM costs $1/hour in market, Elastic Cloud charges $1.20-$1.40/hour)
- Extra cost covers automatic management, monitoring, security, backups, and support
- Autoscaling increases costs when enabled
Important Commands / Syntax
Checking Cluster Health
1
GET /_cluster/health
Response Example:
1
2
3
4
5
6
{
  "cluster_name": "my-deployment",
  "status": "green",
  "number_of_nodes": 7,
  "number_of_data_nodes": 5
}
Listing All Nodes
1
GET /_cat/nodes?v
Response Columns:
ip: Node IP addressheap.percent: Current heap usageram.percent: Current RAM usagecpu: CPU usageload_*: System load averagesnode.role: Node roles (h, i, m, r, s, t, etc.)master: Asterisk (*) indicates master nodename: Node hostname
Connecting to Elasticsearch Cloud via Client
Filebeat/Logstash Configuration (using Cloud ID):
1
2
3
4
5
6
7
8
9
10
11
# In Logstash output section
output {
  elasticsearch {
    cloud_id => "my-deployment:dXMtY2VudHJhbDEuZ2NwLmNsb3VkLmVzLmlvJDEyMzQ1..."
    cloud_auth => "elastic:your_password_here"
    data_stream => true
    data_stream_type => "logs"
    data_stream_dataset => "production"
    data_stream_namespace => "instagram"
  }
}
Key Points:
- No need to specify
hostswhen usingcloud_id cloud_authformat:username:password- No certificate configuration required (handled automatically)
- Works with Filebeat, Logstash, Metricbeat, and other Beats
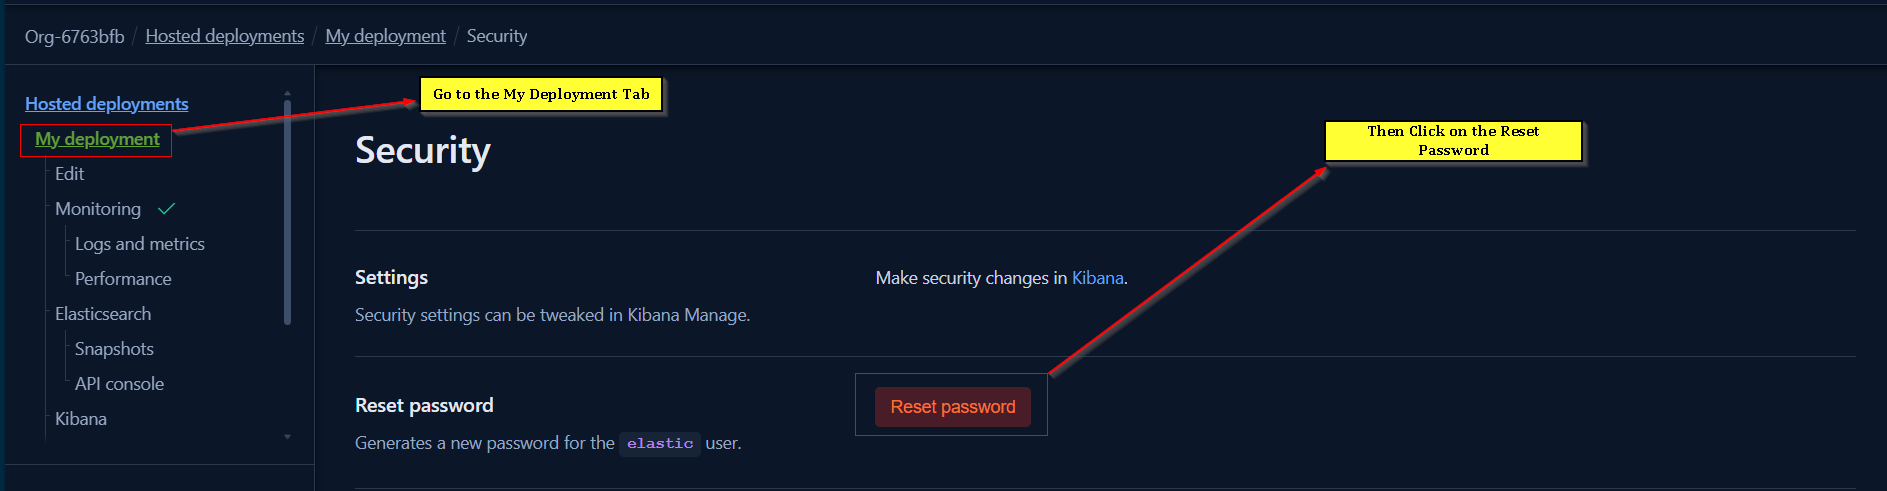
Elasticsearch User Password Reset
Via Security UI:
- Navigate to: Deployment → Security tab → Reset Password
- Warning: Never reset
elasticuser password if agents/beats are already configured with it - Instead, create new users with appropriate roles for production use
Step-by-Step Practical Procedure
Setting Up Elasticsearch Cloud Deployment
Creating a New Deployment:
- Navigate to
https://cloud.elastic.co/ - Click “Start Free Trial”
- Sign up with Gmail account (recommended for ease)
- Complete account setup form (name, company, familiarity level, use case)
- Select deployment preferences:
- Cloud Provider: AWS, Google Cloud, or Microsoft Azure
- Region: Choose closest region (e.g., ap-south-1 for Mumbai)
- Version: Select Elasticsearch version (e.g., 8.19.9)
- Click “Launch”
- Wait 3-5 minutes for deployment to complete
Initial Configuration:
- Deployment name is “My deployment” by default (customizable)
- Free trial provides 14 days of access
- Cluster status changes from “pending” to “healthy” when ready
- Kibana URL automatically generated
- Cloud ID automatically created for client connections
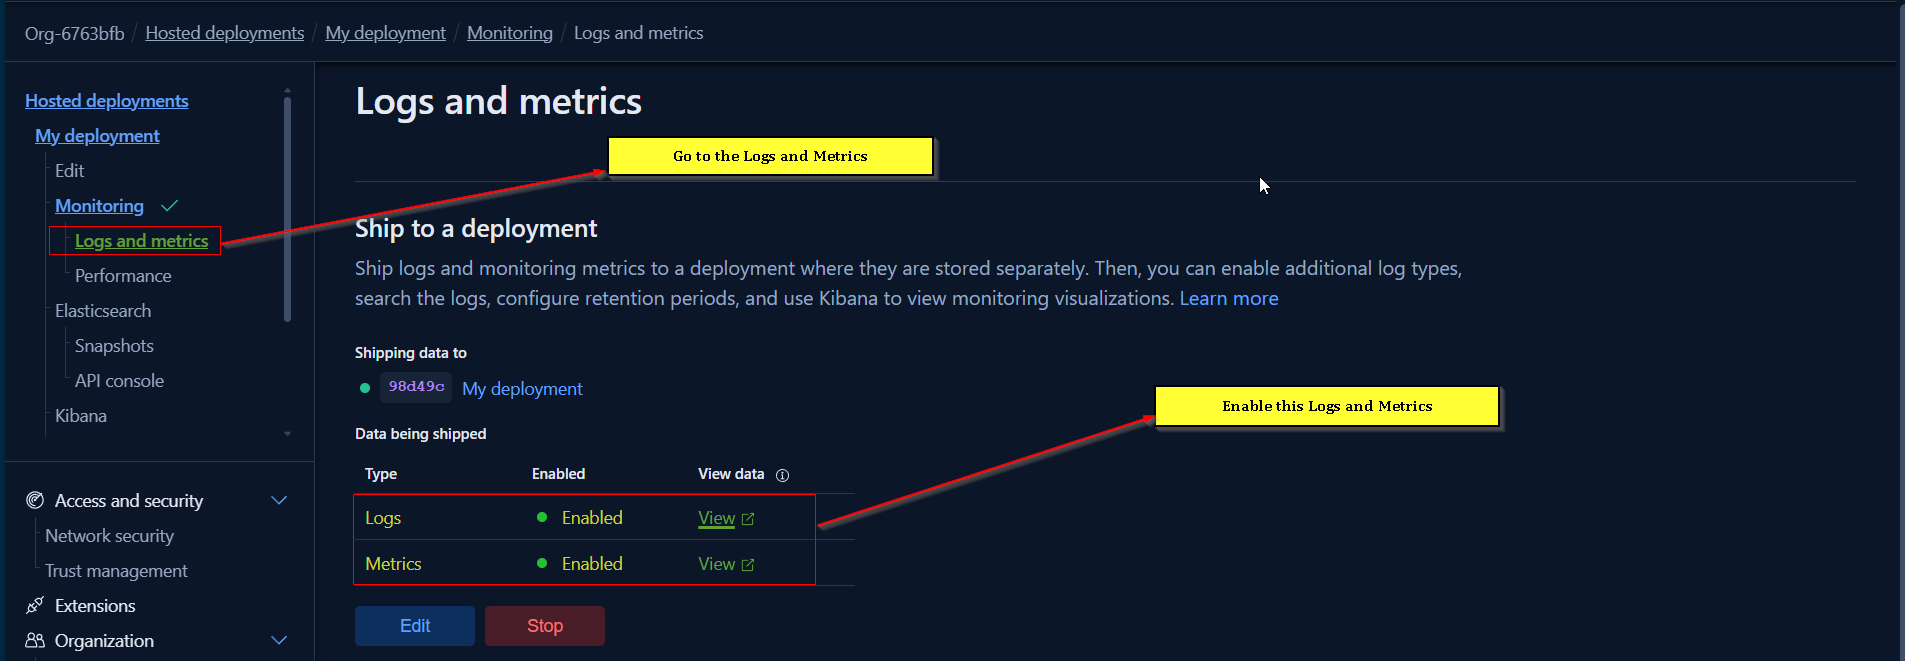
Enabling Stack Monitoring
Activating Monitoring:
- Navigate to: Deployment → Logs and Metrics tab
- Click “Enable”
- Select destination deployment (can use same deployment or create separate monitoring cluster)
- Choose monitoring data types:
- Logs: Elasticsearch application logs
- Metrics: CPU, memory, disk, shard statistics
- Click “Save Changes”
- Wait 1-2 minutes for configuration to apply
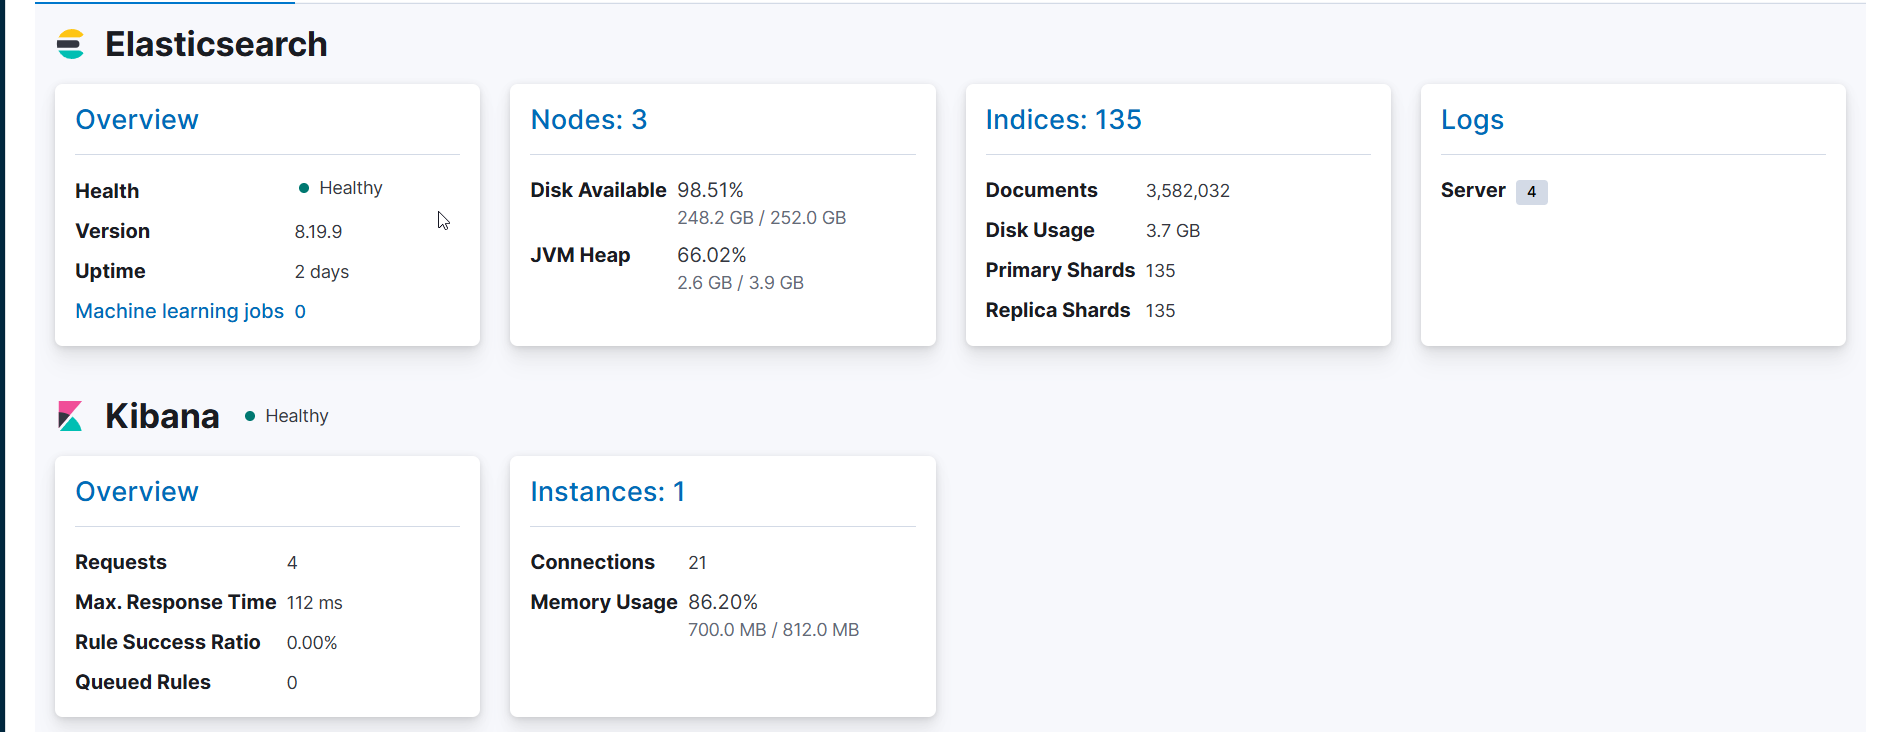
Viewing Monitoring Data:
- Open Kibana → Stack Monitoring
- View cluster overview (nodes, indices, JVM heap, disk usage)
- Click individual nodes for detailed metrics (CPU, memory, I/O operations)
- Review Kibana instances and their health status
Configuring Data Tiers
Adding Hot/Warm/Cold/Frozen Tiers:
- Navigate to: Deployment → Edit
- Scroll to “Add Capacity” section
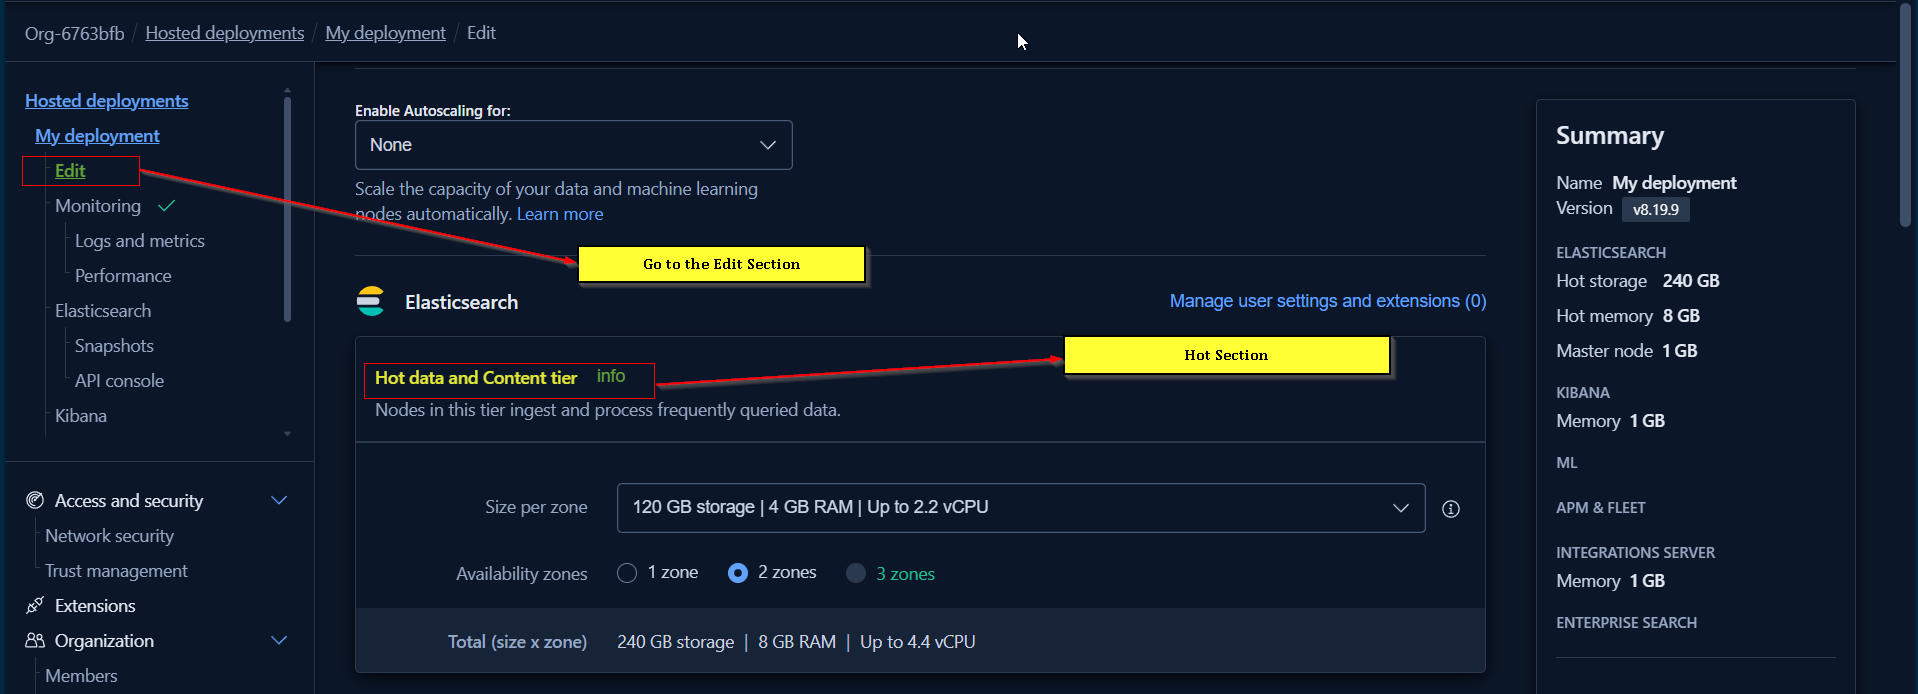
- Select tier to add:
- Warm Tier: 148 GB storage per 2 GB RAM
- Cold Tier: Similar ratio to warm
- Frozen Tier: 6.25 TB storage per 4 GB RAM
- Choose number of availability zones (1 or 2)
- Important: Keep total nodes ≤ 5 to avoid dedicated master requirement (free trial limitation)
- Click “Save”
- Wait for configuration changes to apply (5-10 minutes)
Installing Elastic Agent
Adding Agent via Fleet:
- Navigate to: Kibana → Fleet → Agents
- Click “Add Agent”
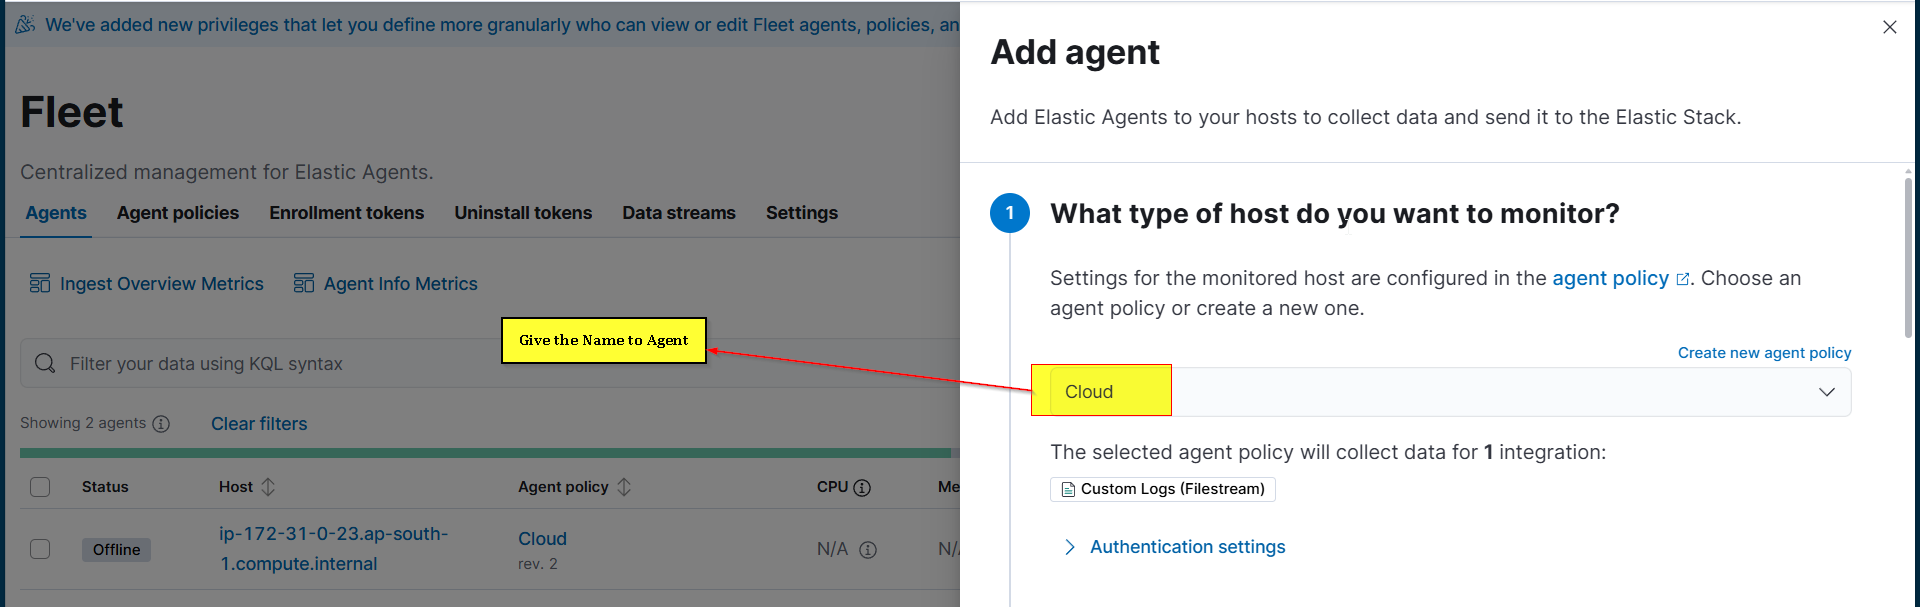
- Select or create agent policy (e.g., “Agent Policy 1”)
- Choose enrollment method: “Enroll in Fleet (recommended)”
- Select platform: Linux (RPM or TAR), Windows, macOS
- Copy provided installation commands
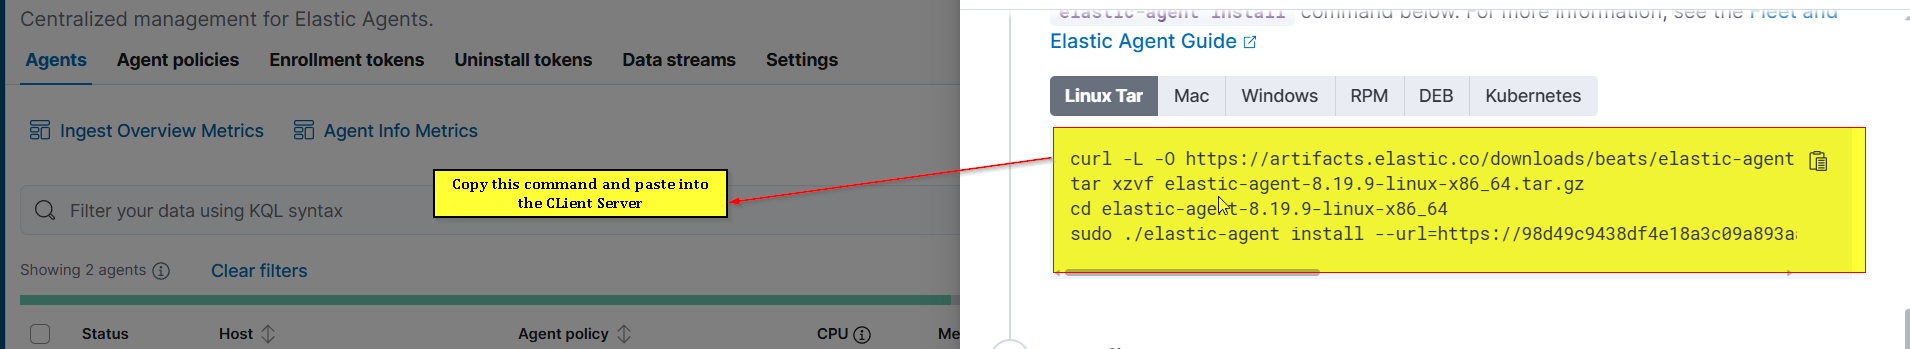
- Execute commands on target server:
- Download Elastic Agent package
- Install package
- Enable and start agent service
- Enroll agent using provided URL and enrollment token
- Verify agent appears in Fleet UI with “Healthy” status
Agent Configuration Inheritance:
- Elasticsearch URL: Automatically configured
- Fleet server URL: Automatically configured
- Certificates: Automatically managed
- Authentication: Uses enrollment token (no manual credential management)
Upgrading Elasticsearch Version
Pre-Upgrade Checks:
- Verify recent snapshot exists: Stack Management → Snapshot and Restore
- Check upgrade assistant: Kibana → Upgrade Assistant
- Resolve deprecation warnings and errors
- Ensure disk watermark thresholds not exceeded
Performing Upgrade:
- Navigate to: Deployment → Manage → Upgrade
- Review current version (e.g., 8.19.9)
- Select target version (e.g., 9.1.9 or 9.2.3)
- Review upgrade requirements and warnings
- Click “Upgrade”
- Confirm upgrade
- Monitor upgrade progress (node-by-node upgrade prevents downtime)
Upgrade Process:
- Frozen tier nodes upgraded first
- Then cold tier, warm tier
- Hot tier nodes upgraded one at a time (maintains availability)
- Kibana upgraded after Elasticsearch
- Duration depends on data volume (30 minutes to several hours for large deployments)
Managing Snapshots and Restore
Automatic Snapshots:
- Configured by default (every 30 minutes)
- Stored in cloud storage (AWS S3, Google Cloud Storage, Azure Blob)
- Policy name: “cloud-snapshot-policy”
- Repository: Automatically created
Manual Restore:
- Navigate to: Stack Management → Snapshot and Restore → Snapshots
- Select snapshot by timestamp
- Click “Restore”
- Choose indices/data streams to restore:
- Restore all indices
- Select specific indices/data streams
- Configure restore options (rename patterns, index settings)
- Click “Restore snapshot”
- Monitor restore progress in Restore tab
Common Issues & Troubleshooting
Watermark Threshold Exceeded
Issue: Upgrade blocked due to disk watermark exceeded warning
Resolution:
- Disable stack monitoring temporarily (if just enabled for testing)
- Delete unnecessary indices or data streams
- Navigate to: Index Management → Indices
- Delete monitoring indices if not needed:
.monitoring-*,metricbeat-*,filebeat-* - Increase storage capacity (if in paid subscription)
- Wait 5-10 minutes for cluster to recalculate disk usage
Cannot Create Multiple Deployments
Issue: “Trials are limited to only one deployment at a time”
Resolution:
- Free trial allows only 1 deployment
- To create additional deployments, upgrade to paid subscription
- Alternatively, delete existing deployment and create new one
- Or create new account with different email for separate trial
Cannot Join Organization
Issue: “You cannot join this organization” when accepting invite
Resolution:
- User already belongs to another Elasticsearch Cloud organization
- Cannot belong to multiple organizations with same email
- Must leave current organization or use different email address
- Contact organization admin to resolve membership conflicts
Autoscaling Not Available
Issue: Autoscaling option grayed out or shows “limit reached”
Resolution:
- Autoscaling not available in free trial
- Requires paid subscription
- Autoscaling only scales UP automatically (not down)
- Manual intervention required to scale down (prevents unexpected cost reduction affecting performance)
Enterprise Search Configuration Error
Issue: Upgrade assistant shows “Enterprise search configurations must be removed”
Resolution:
- Navigate to: Deployment → Edit
- Scroll to Enterprise Search section
- Click red “X” to remove Enterprise Search instance
- Click “Save” and confirm
- Wait for changes to apply (configuration removal takes 5-10 minutes)
Summary / Key Takeaways
Managed vs Unmanaged Elasticsearch:
- Managed service eliminates manual installation, security configuration, monitoring, and upgrades
- All operational tasks handled through UI-based configuration
- Significantly reduces operational overhead and expertise requirements
Deployment Architecture:
- Default free trial: 2 hot nodes (240 GB, 8 GB RAM), 1 Kibana, 1 Fleet server
- Paid plans support warm/cold/frozen tiers for cost optimization
- Multi-zone deployment ensures high availability (99.95% SLA)
Automatic Features:
- SSL/TLS certificates managed automatically (no expiration concerns)
- Snapshots every 30 minutes to cloud storage
- Service auto-restart on high resource utilization (>95%)
- Email alerts with root cause analysis for incidents
Cost Considerations:
- Free trial: 14 days (extendable to 45 days), no credit card required
- Paid subscriptions charge premium over infrastructure costs for management services
- Autoscaling increases costs automatically (scales up only, manual scale-down)
Upgrade Process:
- One-click upgrades between Elasticsearch versions
- Rolling upgrades node-by-node prevent downtime
- Automatic data migration and compatibility checks
- Duration depends on data volume (minutes to hours)
Client Connection:
- Use
cloud_idandcloud_authinstead of individual host configuration - No certificate management required
- Works with all Elastic Stack components (Beats, Logstash)
Monitoring & Observability:
- Stack Monitoring enabled with one click
- Logs and metrics automatically collected and visualized
- Node-level and cluster-level metrics available
- Performance graphs for CPU, memory, disk, and shard operations
Limitations:
- Free trial limited to 1 deployment
- Cannot enable autoscaling in free trial
- Dedicated master nodes require paid subscription
- Coordinating and ingest nodes require paid subscription
Best Practices:
- Use separate monitoring cluster in production (not recommended to monitor on same cluster)
- Create custom users instead of using
elasticsuperuser for production integrations - Verify snapshot recency before performing upgrades
- Monitor disk watermark thresholds to prevent upgrade blocks
- Deploy across multiple availability zones for high availability
When to Use Managed Service:
- Limited DevOps resources or Elasticsearch expertise
- Need for guaranteed uptime (SLA requirements)
- Rapid deployment requirements (minutes vs hours/days)
- Automatic compliance with security best practices
- Cost of management overhead exceeds service premium