Elastic Search
1. What is Elasticsearch?
- A distributed search and analytics engine.
- Core component of the ELK Stack:
- E → Elasticsearch (Database / Search Engine)
- L → Logstash (Pipeline / Data Processing)
- K → Kibana (UI / Visualization)
2. Why Elasticsearch is Needed
- For observability:
- Monitoring apps, servers, networks, databases.
- Detecting issues, failures, anomalies.
- Centralizing logs and operational data.
- Faster search, distributed storage, real-time indexing.
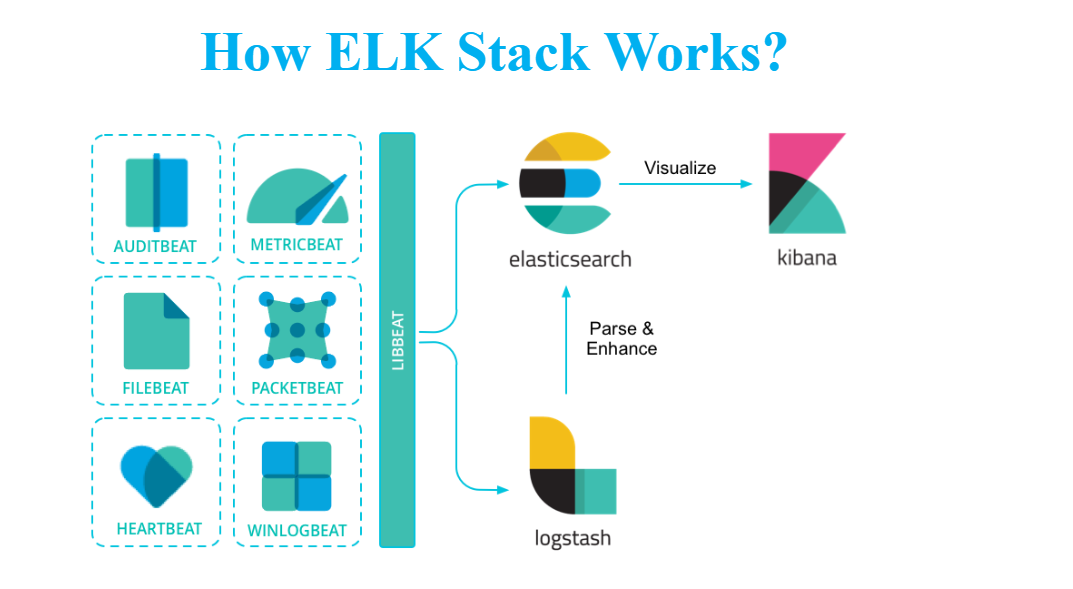
3. ELK Flow Overview
Data sources → (Beats / Logstash) → Elasticsearch → Kibana Dashboard
Sources can be:
- Cloud apps
- On-prem servers
- Databases
- Network devices
- Security tools
All data ultimately lands in Elasticsearch → Kibana visualizes it.
4. ELK vs Grafana
- Kibana = official visualization component of Elastic.
- Grafana = external visualization platform (popular competitor).
- Grafana can also read data from Elasticsearch.
5. Downloading Elasticsearch
Steps:
- Go to Google → search “Download Elasticsearch”.
- Use official link.
- Recommended version practice:
- Never use the latest version in production.
- Use N-1 version (previous stable version).
- To download older versions → “View past releases”.
6. File Organization
Create a folder to store all ELK components:
1
D:\ELKSetup
Store:
- Elasticsearch
- Kibana
- Logstash
- Beats
7. Extracting Elasticsearch
- Use 7-Zip (not Windows default Extract All).
- Extract into your ELKSetup folder.
8. Elasticsearch Folder Structure
Inside Elasticsearch:
🔹 bin/
Contains executable scripts:
1
2
3
4
5
elasticsearch → Start Elasticsearch
elasticsearch-create-enrollment-token
elasticsearch-keystore
elasticsearch-setup-passwords
elasticsearch-reset-password
🔹 config/
Important configuration files:
- elasticsearch.yml → Main configuration
- jvm.options → JVM memory settings
- certs folder → SSL certificates
- roles/users → Security settings (RBAC)
🔹 jdk/
Bundled Java version (no need to install Java separately).
🔹 logs/
Stores Elasticsearch logs.
🔹 data/
Stores indexed documents (actual data).
9. Configuring elasticsearch.yml
Most important settings:
1. Cluster Name
1
cluster.name: batch6
- All nodes must share same cluster name.
2. Node Name
1
node.name: elk1
- Each machine must have unique node name.
3. Data & Log Paths
Create folders:
1
2
D:\ELKData
D:\ELKLogs
Update config:
1
2
path.data: D:/ELKData
path.logs: D:/ELKLogs
4. Network Host (IP)
Local setup:
1
network.host: localhost
Production:
1
network.host: <server-ip>
5. HTTP Port
1
http.port: 9200
Default: 9200
6. SSL Security Settings
Elasticsearch adds SSL settings automatically after first run:
1
2
xpack.security.enabled: true
xpack.security.http.ssl.enabled: true
Keep these unless setting up custom certificates.
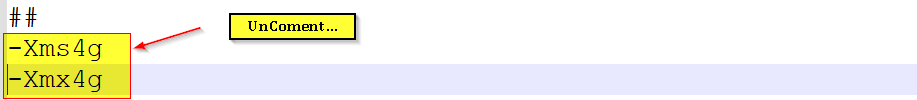
10. Configuring jvm.options
Elasticsearch is Java-based → requires JVM heap memory.
Recommended:
- set heap = 50% of system memory
- max 32GB (JVM limit)
Example:
11. Running Elasticsearch
Steps:
- Open CMD.
- Navigate to bin folder:
1
cd D:\ELKSetup\elasticsearch\bin
- Run:
1
.\elasticsearch``
Elasticsearch starts and prints logs.
12. First Run: Important Outputs
Elasticsearch auto-creates:
- built-in user elastic
- auto-generated password
Example:
1
2
Username: elastic
Password: <auto-generated>
Save this password safely.
13. Accessing Elasticsearch
Use browser:
If SSL enabled:
1
https://localhost:9200

If SSL disabled:
1
http://localhost:9200

Enter credentials.
You should see:
- cluster name
- node name
- version
- build info
14. Understanding Logs
Locate logs:
1
D:\ELKLogs
Use logs to debug:
- misconfiguration
- file path errors
- incorrect indentation in .yml
Common error locations:
- line numbers shown in logs
- incorrect spacing
- wrong path format
15. Cluster Health Colors
- Green → All good
- Yellow → Working but missing replicas
- Red → Cluster failure
16. Practice Tasks
✔ Change cluster name
✔ Change node name
✔ Change port (9200 → 9400)
✔ Change logs path
✔ Introduce error → check logs
Understand how ES behaves after each change.
18. Extra Homework Suggested
Ask ChatGPT:
- What is Elasticsearch?
- Why do we use Elasticsearch?
- 10–15 business use cases for observability with Elasticsearch.
- Explain cluster and node with diagrams.