Elasticsearch Alerting & Watchers
1. Overview / Introduction
Alerting in Elasticsearch enables automated monitoring and notifications based on specific conditions in your data. Instead of manually monitoring dashboards 24/7, you can configure alerts that automatically notify relevant teams when critical events occur (server downtime, high CPU utilization, errors, etc.).
Key Benefits:
- Eliminates need for constant manual monitoring
- Provides immediate notifications via email, Microsoft Teams, Slack, etc.
- Enables proactive response to issues before business impact
- Supports team-specific alerts based on application ownership
Two Main Approaches:
- Rules - Simpler, UI-based approach for straightforward alerting scenarios
- Watchers - Advanced, JSON-based approach for complex alerting logic (X-Pack feature)
2. Important Concepts & Definitions
Alerting Components
Connectors:
- Configuration that stores credentials and connection details for alert destinations
- Must be configured before creating alerts
- Examples: Gmail connector, Microsoft Teams connector, Slack connector
Trigger/Schedule:
- Defines how frequently the alert condition is checked
- Examples: every 5 minutes, every hour, daily
Input:
- Specifies which index to query
- Defines which fields to retrieve
Query/Filter:
- Conditions that must be met for alert to trigger
- Examples:
method_type = DELETE,browser_name = Chrome
Range:
- Time window for data analysis
- Examples: last 15 minutes, last 30 days, now minus 1 day
Condition:
- Threshold that determines when to send alert
- Examples:
hits >= 1,count > 10
Action:
- What happens when condition is met
- Examples: send email, create index, ping Microsoft Teams
Priority Levels (P1, P2, P3, P4)
P1 (Priority 1):
- Critical issues with immediate business impact
- Example: Complete server downtime
- Response time: ~15 minutes acknowledgment required
- 24/7 monitoring team responds immediately
P2 (Priority 2):
- High priority but not critical
- Example: High CPU utilization (>85%)
- Response time: ~30-45 minutes acknowledgment
P3 (Priority 3):
- Medium priority issues
- Example: Website slowness
P4 (Priority 4):
- Low priority issues
X-Pack Features
X-Pack is Elasticsearch’s premium feature bundle that includes:
- Machine Learning
- Alerting (Watchers)
- Graph Capabilities
- JDBC & ODBC Connectivity
- Advanced Security (authentication via SSO, LDAP, etc.)
- Auditing (tracks who logged in, modified dashboards, deleted indices)
- Document-level Security (field-level access control)
Trial: 30-day free trial available via Stack Management
3. Important Commands / Syntax
Telnet Command (Check Server Connectivity)
1
2
3
4
5
# Check if Gmail SMTP server is accessible
telnet smtp.gmail.com 465

# Expected output: Connection successful
# If fails: Connection refused or timeout
Store Email Password in Elasticsearch Keystore
1
2
3
4
5
# Add secure password to keystore
bin/elasticsearch-keystore add xpack.notification.email.account.gmail.smtp.secure_password

# List keystore entries
bin/elasticsearch-keystore list
Elasticsearch Configuration (elasticsearch.yml)
1
2
3
4
5
6
7
8
xpack.notification.email.account:
  gmail_account:
    profile: gmail
    smtp:
      auth: true
      host: smtp.gmail.com
      port: 465
      user: your-email@gmail.com
Note: Password is stored in keystore, not in config file. Restart Elasticsearch after configuration changes.
4. Step-by-Step Practical Procedure
A. Configure Email Connector
Step 1: Enable Trial License
- Go to Stack Management → License Management
- Click Start Trial (30-day trial)
- Trial expires in 30 days from activation
Step 2: Create Gmail App Password
- Go to Google Account settings
- Navigate to Security → 2-Step Verification → App Passwords
- Create new app password named “Elasticsearch”
- Copy the 16-character password (save it securely)
Step 3: Test Server Connectivity
1
2
telnet smtp.gmail.com 465
# Should return: "Connecting to smtp.gmail.com..."
Step 4: Configure Elasticsearch
1
2
3
# Add password to keystore
bin/elasticsearch-keystore add xpack.notification.email.account.gmail.smtp.secure_password
# Enter app password when prompted
Add to elasticsearch.yml:
1
2
3
4
5
6
7
8
xpack.notification.email.account:
  gmail_account:
    profile: gmail
    smtp:
      auth: true
      host: smtp.gmail.com
      port: 465
      user: your-email@gmail.com
Restart Elasticsearch service.
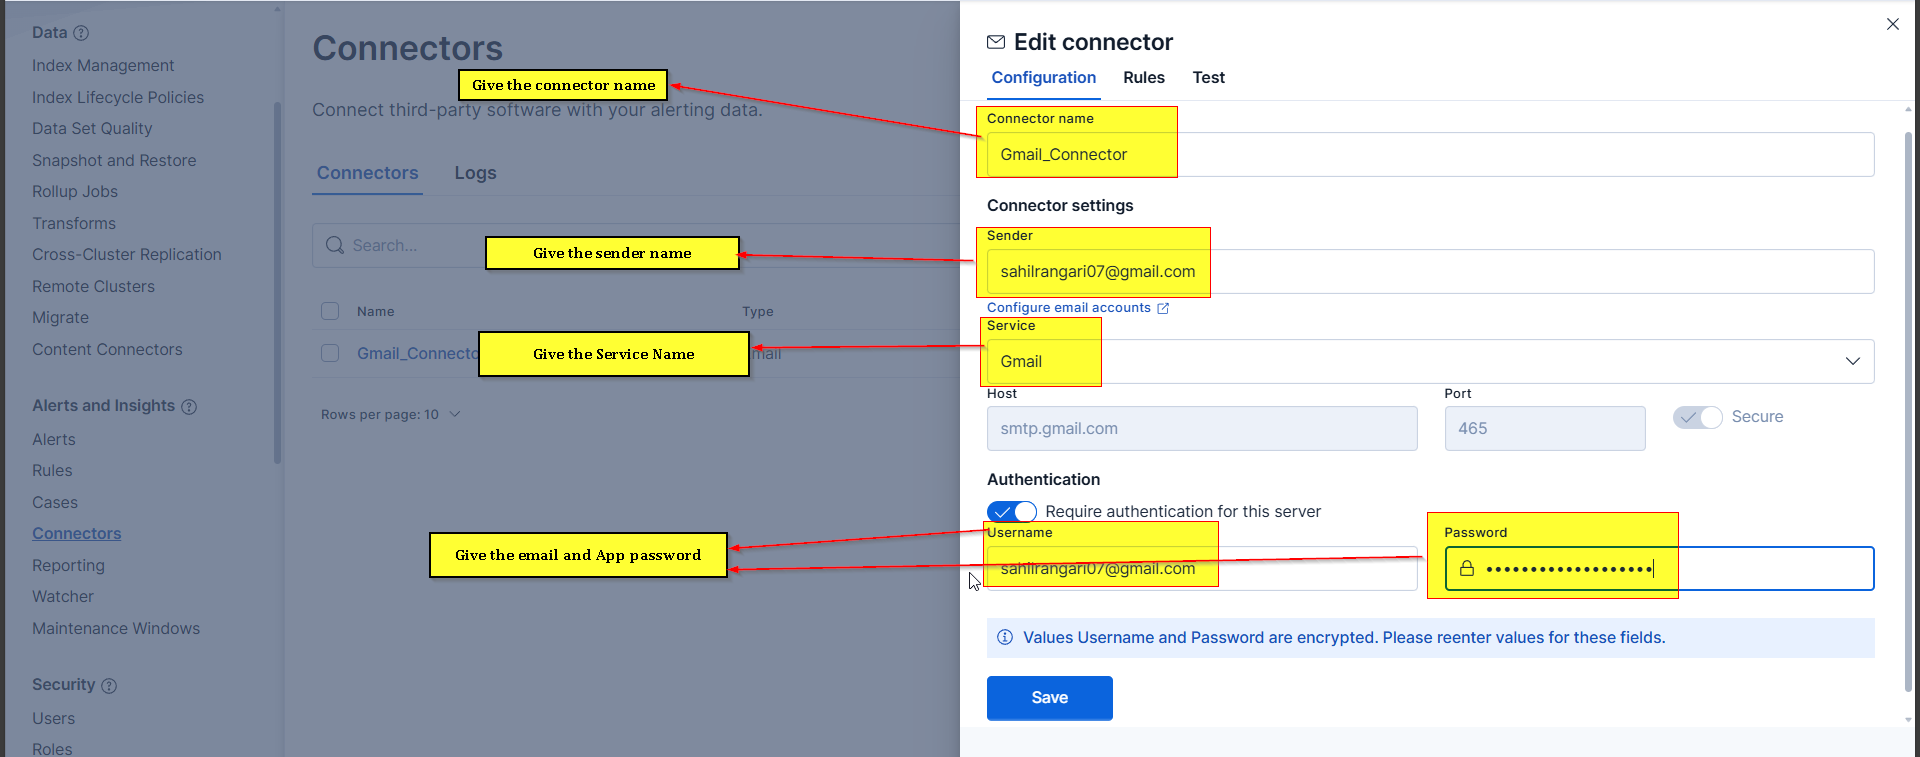
Step 5: Create Connector in Kibana
- Go to Stack Management → Connectors
- Click Create Connector → Email
- Fill in details:
- Name: Gmail_Connector
- Sender: your-email@gmail.com
- Service: Gmail
- Username: your-email@gmail.com
- Password: [App password from Step 2]
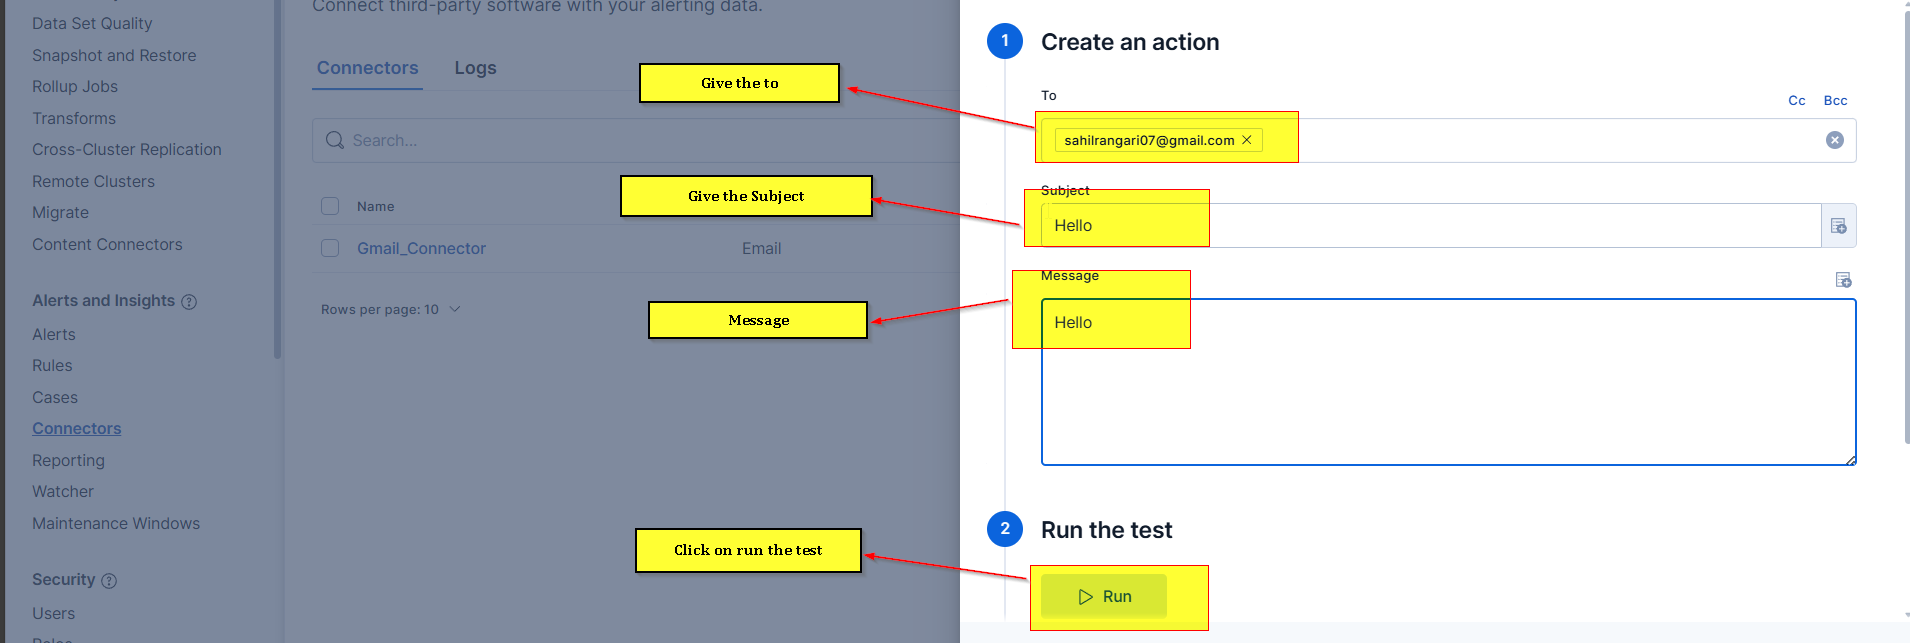
- Click Save & Test
- Send test email to verify
B. Create Alert Using Discover (Query Preparation)
Step 1: Identify Data in Discover
- Go to Discover
- Select index pattern (e.g.,
data-*) - Apply filters for your alert condition:
- Example:
method_type: DELETEANDbrowser_name: Chrome
- Example:
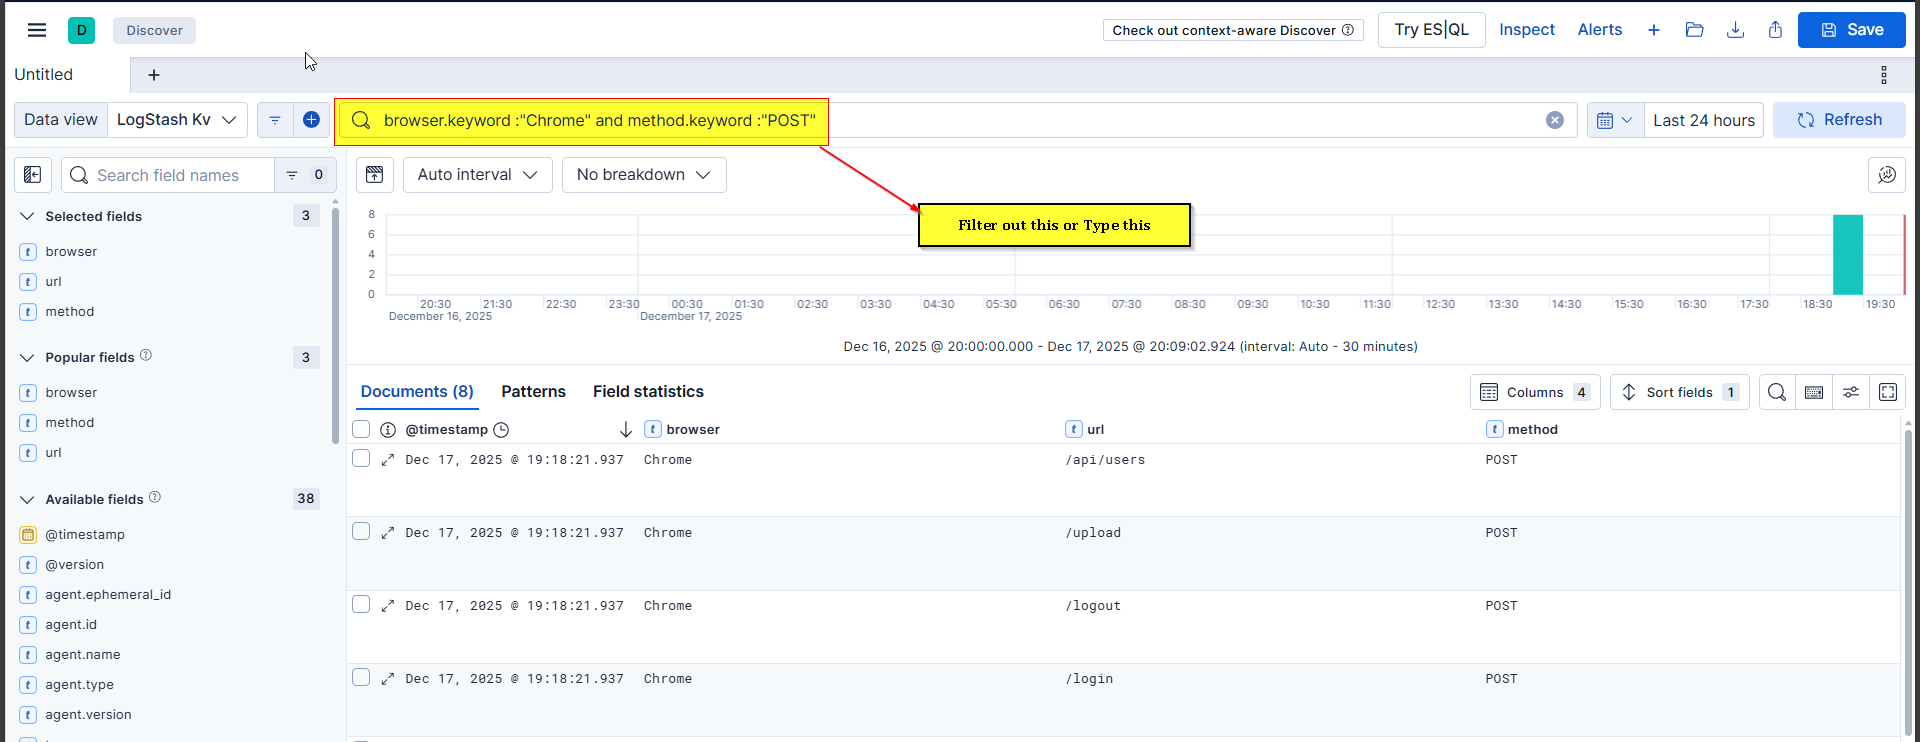
Step 2: Verify Results
- Check that data displays correctly
- Note the field names (exact case matters)
- Verify time range (last 15 minutes, last 30 days, etc.)
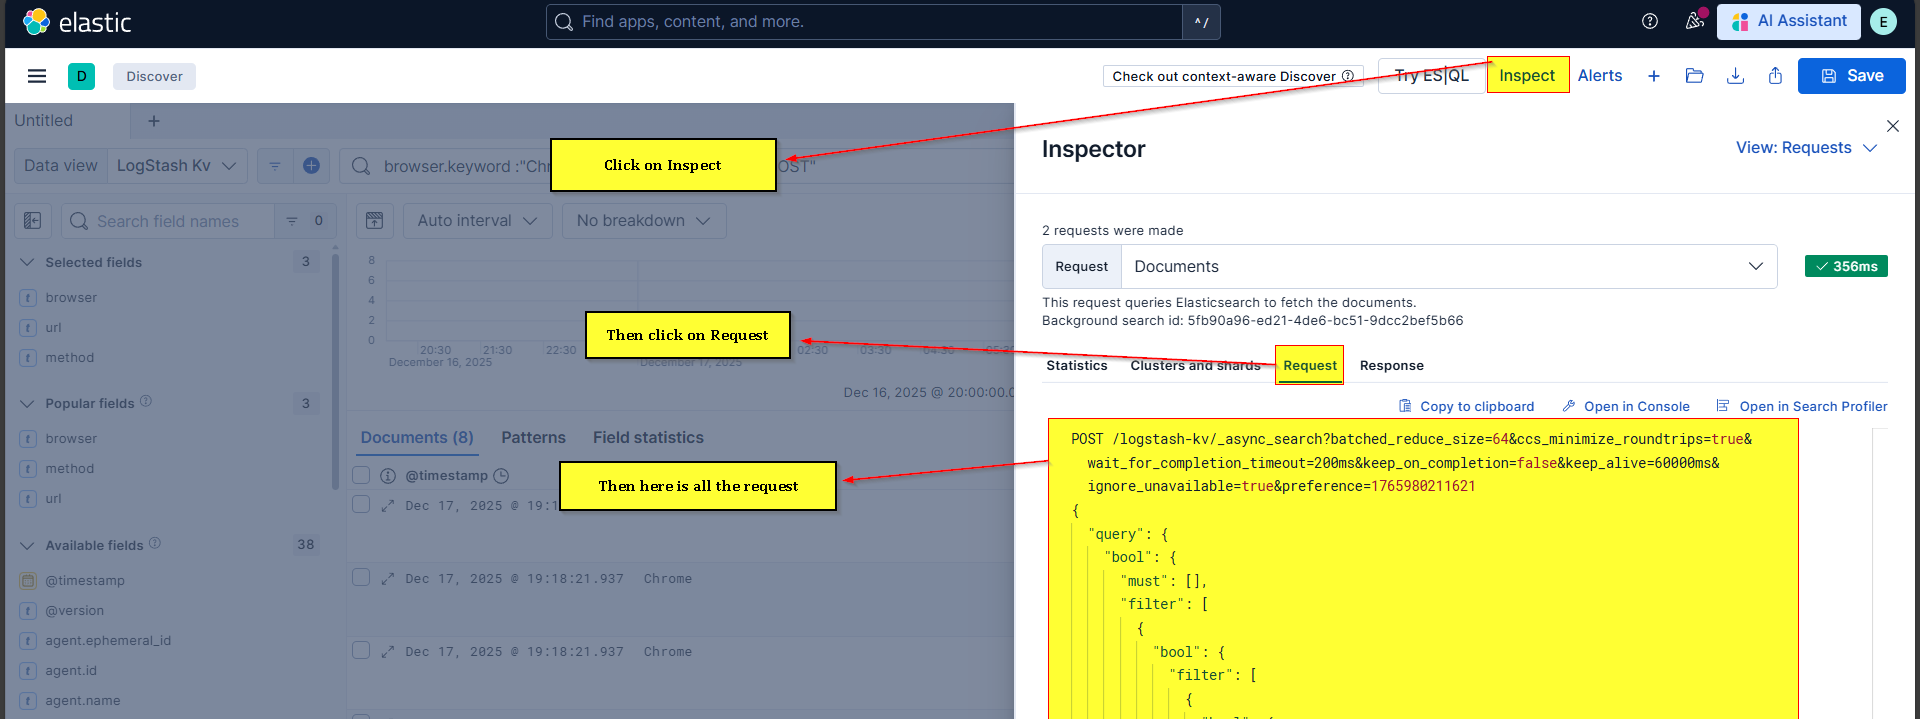
Step 3: Extract Query
- Click Inspect on the query
- Click Request → Copy to clipboard
- Open Dev Tools
- Paste the copied query
- Locate the second filter section (before
range) - Copy filter content between opening bracket and
range
C. Create Watcher
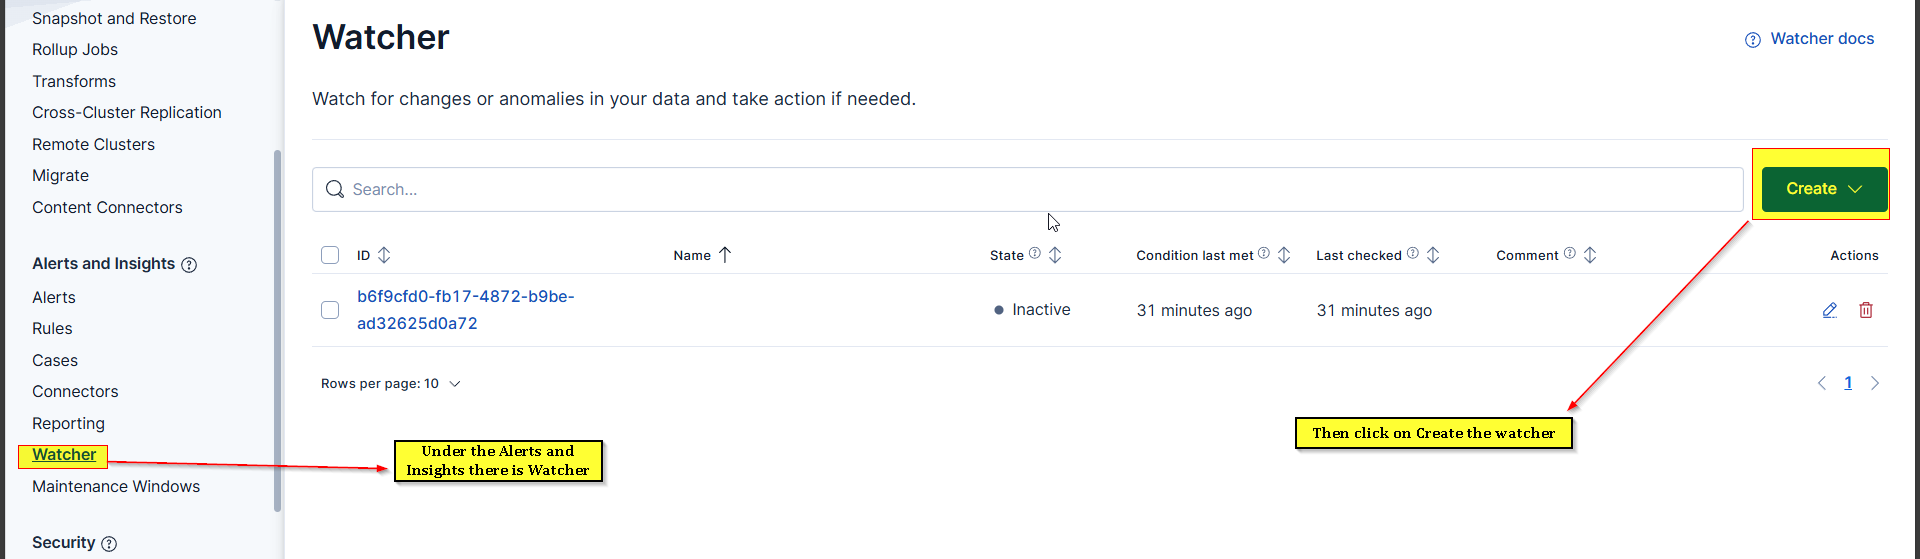
Step 1: Navigate to Watchers
- Go to Stack Management → Watcher
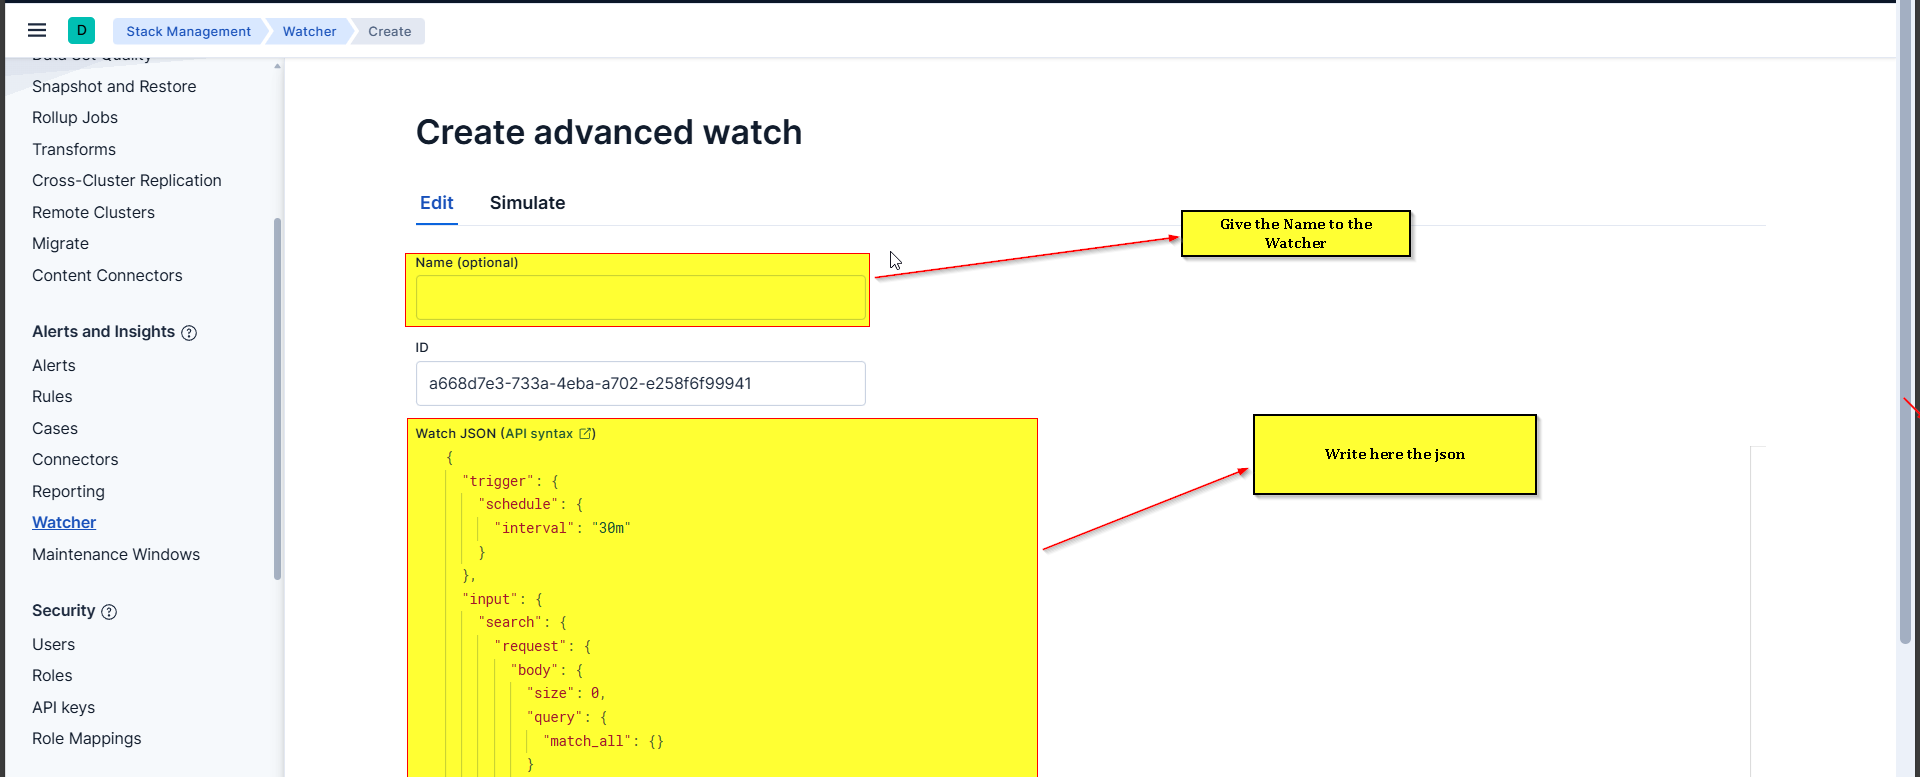
- Click Create → Create Advanced Watch
Step 2: Define Watcher Structure
1
2
3
4
5
6
7
8
9
10
11
12
13
14
15
16
17
18
19
20
21
22
23
24
25
26
27
28
29
30
31
32
33
34
35
36
37
38
39
40
41
42
43
44
45
46
47
48
49
50
51
52
53
54
55
56
57
58
59
60
61
62
63
64
65
66
67
68
69
70
71
72
73
74
75
76
77
78
79
80
81
82
83
84
85
86
87
88
89
90
91
92
93
{
  "trigger": {
    "schedule": {
      "interval": "5m"
    }
  },
  "input": {
    "search": {
      "request": {
        "search_type": "query_then_fetch",
        "indices": [
          "logstash-kv"
        ],
        "rest_total_hits_as_int": true,
        "body": {
          "size": 10,
          "_source": [
            "browser",
            "url",
            "method",
            "@timestamp"
          ],
          "query": {
            "bool": {
              "filter": [
                {
                  "term": {
                    "method.keyword": "POST"
                  }
                },
                {
                  "term": {
                    "browser.keyword": "Chrome"
                  }
                },
                {
                  "range": {
                    "@timestamp": {
                      "gte": "now-30d/d",
                      "lte": "now"
                    }
                  }
                }
              ]
            }
          }
        }
      }
    }
  },
  "condition": {
    "compare": {
      "ctx.payload.hits.total": {
        "gte": 1
      }
    }
  },
  "actions": {
    "send_email": {
      "email": {
        "profile": "gmail",
        "from": "sahilrangari07@gmail.com",
        "to": [
          "sahilrangari07@gmail.com",
          "aishwarya1424petkar@gmail.com"
        ],
        "subject": "Data Deleted from Amazon Application",
        "body": {
          "html": """
          <h3>Data Deleted from Amazon Application</h3>
          <p>Total records found (Last 30 Days): </p>
          <table border='1'>
            <tr>
              <th>Browser</th>
              <th>Method</th>
              <th>URL</th>
              <th>Timestamp</th>
            </tr>

            <tr>
              <td></td>
              <td></td>
              <td></td>
              <td></td>
            </tr>

          </table>
          """
        }
      }
    }
  }
}
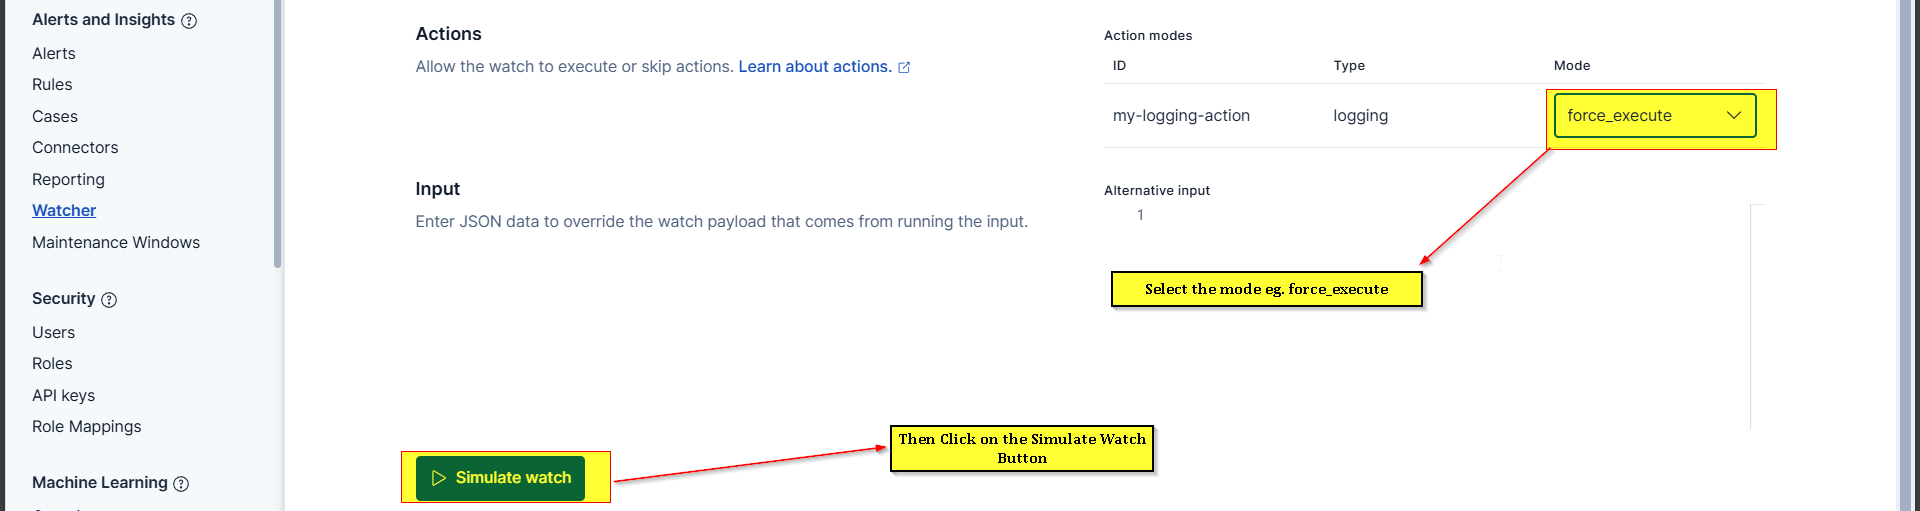
Step 3: Test Watcher
- Click Simulate to test without sending actual email
- Check results:
- Condition Met: Shows if alert would trigger
- Actions: Shows email content that would be sent
- If satisfied, click Create Watch
Step 4: Force Execute (Manual Test)
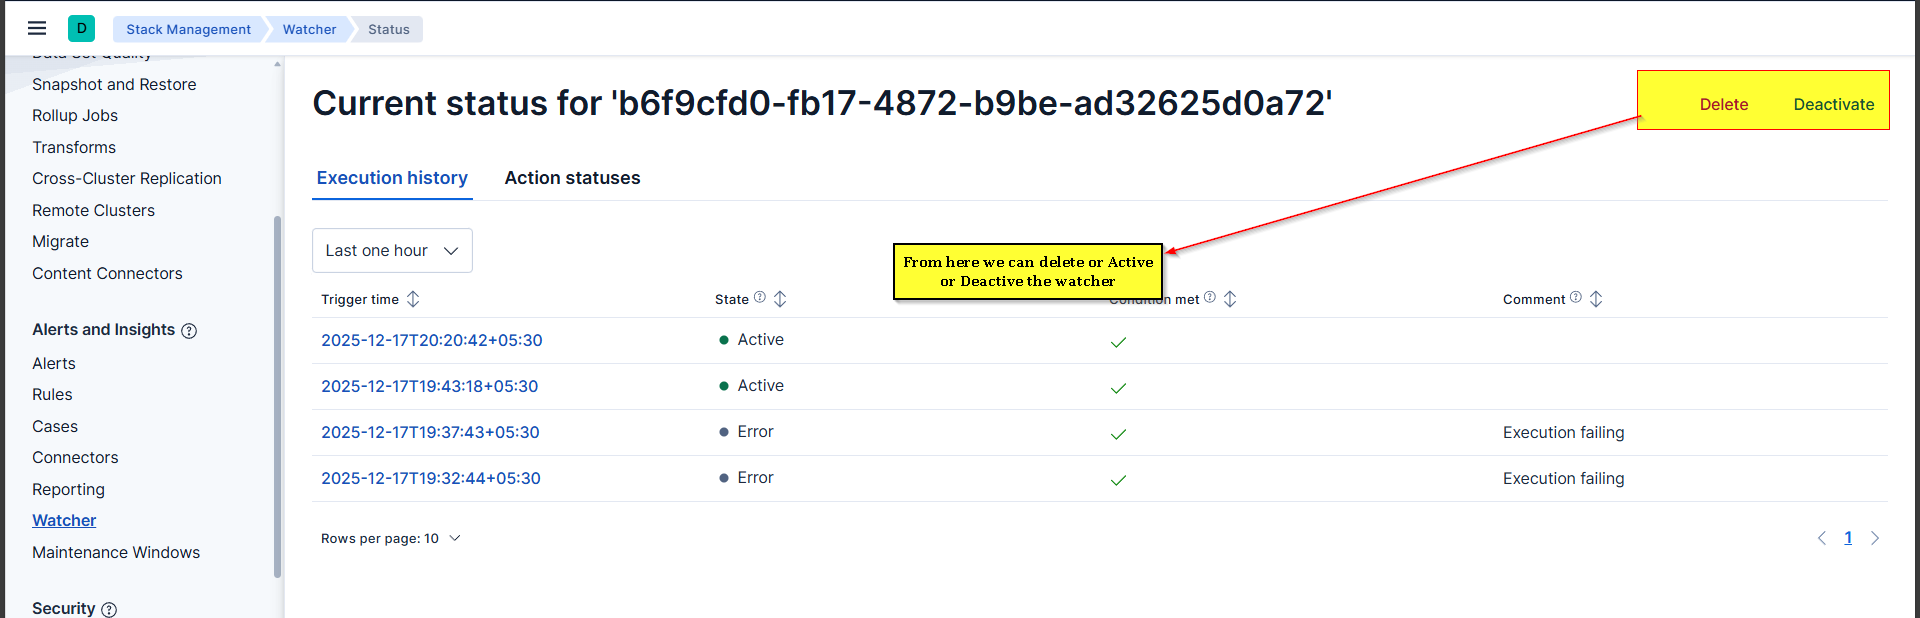
- Click on watcher ID
- Click Execute (forces immediate execution)
- Check email inbox for alert
Step 5: Manage Watcher
- Deactivate: Temporarily disable without deleting
- Delete: Permanently remove watcher
- View History: See execution history (success/failure)
D. Create Alert Using Rules (Simpler Alternative)
- Go to Stack Management → Rules
- Click Create Rule
- Select rule type: Elasticsearch Query
- Configure:
- Index: data-*
- Time field: timestamp
- Query: Use KQL (e.g.,
method_type:DELETE) - Threshold: Matches >= 1
- Check every: 5 minutes
- For the last: 15 minutes
- Action: Email
- Select connector and configure email template
- Save and activate
5. Common Issues & Troubleshooting
Issue 1: Gmail Connection Refused
Error: Could not open connection to the host on port 465
Solutions:
- Verify Gmail SMTP settings:
smtp.gmail.comon port465 - Check firewall allows outbound connections on port 465
- Test with telnet:
telnet smtp.gmail.com 465 - Ensure Elasticsearch server has internet access
Issue 2: Authentication Failed
Error: Application-specific password required
Solutions:
- Do NOT use regular Gmail password
- Create App Password in Google Account Security settings
- Use 16-character app password in keystore
- Enable 2-Step Verification in Google Account first
Issue 3: Watcher Not Triggering
Possible Causes:
- Condition not met: Check actual hit count in Discover
- Wrong time range: Verify
rangematches data timestamps - Filter errors: Ensure field names match exactly (case-sensitive)
- Watcher deactivated: Check watcher status
Debug Steps:
- Test query in Discover first
- Use Simulate to see what watcher would return
- Check watcher execution history
- Verify condition logic (gte, lte, gt, lt)
Issue 4: No Email Received
Solutions:
- Check spam/junk folder
- Verify email addresses in
tofield - Check connector test succeeded
- Review watcher execution history for errors
- Ensure Elasticsearch service restarted after keystore changes
Issue 5: Too Many Alerts
Problem: Alert triggers every minute for old data
Solution:
- Adjust time range: Change from
now-30dtonow-15m - Increase schedule interval: Change from
1mto15m - Add more specific filters to reduce false positives
7. Summary / Key Takeaways
Core Concepts
- Alerting eliminates 24/7 manual monitoring by automatically notifying teams of critical events
- Two approaches: Rules (simple, UI-based) and Watchers (advanced, JSON-based)
- X-Pack features (including Watchers) require paid license but offer 30-day trial
Email Configuration Essentials
- Use App Password, not regular Gmail password
- Store password in Elasticsearch keystore for security
- Always restart Elasticsearch after keystore/config changes
- Test connectivity with
telnet smtp.gmail.com 465
Watcher Structure ``` Trigger (when to check) → Input (which index + filters) → Condition (threshold to meet) → Action (what to do)
Best Practices
- Test queries in Discover first before creating watchers
- Use appropriate time ranges (last 15m for real-time, not 30d)
- Limit result size to avoid overwhelming email bodies
- Use priority levels (P1, P2, P3) to indicate urgency
- Simulate watchers before activation to verify behavior
- Deactivate instead of delete when temporarily disabling alerts
Common Pitfalls to Avoid
- Using regular Gmail password instead of App Password
- Forgetting to restart Elasticsearch after config changes
- Setting time range too wide (causes duplicate alerts)
- Not testing queries in Discover before implementing in watcher
- Case-sensitive field names in filters
Production Considerations
- Service Now integration is standard in most organizations for ticketing
- Acknowledge P1 alerts within 15 minutes (organizational standard)
- Maintain alert history for compliance and troubleshooting
- Monitor watcher execution logs to identify failing alerts